(Pattern Energy Group, 5.Nov.2018) — Pattern Energy Group Inc. announced its financial results for the 2018 third quarter.
Highlights
(Comparisons made between fiscal Q3 2018 and fiscal Q3 2017 results, unless otherwise noted)
— Proportional gigawatt hours (“GWh”) sold of 1,623 GWh, up 7%
— Net cash provided by operating activities of $106.9 million
— Cash available for distribution (CAFD) of $31.7 million, up 235% and on track to meet full year guidance(1)
— Net loss of $31.5 million
— Adjusted EBITDA of $79.5 million, up 45%
— Revenue of $118.4 million, up 29%
— Declared a fourth quarter dividend of $0.4220 per Class A common share or $1.688 on an annualized basis, subsequent to the end of the period, unchanged from the previous quarter’s dividend
— Committed to a plan to repower the 283 MW Gulf Wind project starting in 2019
— Acquired a 51% owned interest in the 143 MW Mont Sainte-Marguerite project in Québec, for a purchase price of $37.7 million, representing a 10x multiple of the five-year average CAFD(1) of the project
— Completed the sale of the Company’s operations in Chile, which principally consist of its 81 MW owned interest in the 115 MW El Arrayán project for which Pattern Energy received cash proceeds of $70.4 million
“It was another solid quarter with CAFD up more than three times the same period last year, which puts us in a great position to achieve our targeted CAFD(1) for the year,” said Mike Garland, President of Pattern Energy. “We continue to take proactive measures to increase our CAFD without issuing common equity including, asset recycling, repowering Gulf Wind and the implementation of cost savings. During the quarter we sold El Arrayán at a premium to the multiple at which we trade and we are in the final stages of a second sale. This asset recycling provides us additional flexibility to make new investments in accretive opportunities, like the Mont Sainte-Marguerite acquisition or the Gulf Wind repowering, which increase CAFD. As the opportunity set at Pattern Energy Group 2 LP (“Pattern Development 2.0”) continues to mature and grow, especially in exciting markets like Japan, our material ownership interest in the development business is a clear differentiator to other players in the market.”
(1) The forward looking measures of 2018 full year cash available for distribution (CAFD) and the five-year average annual purchase price multiple are non-GAAP measures that cannot be reconciled to net cash provided by operating activities as the most directly comparable GAAP financial measure without unreasonable effort primarily because of the uncertainties involved in estimating forward-looking changes in working capital balances which are added to earnings to arrive at cash provided by operations and subtracted therefrom to arrive at CAFD. A description of the adjustments to determine CAFD can be found within Item 2, Management’s Discussion and Analysis of Financial Condition and Results of Operations – Key Metrics, of Pattern Energy’s 2018 Quarterly Report on Form 10-Q for the period ended September 30, 2018.
Financial and Operating Results
Pattern Energy sold 1,622,991 megawatt hours (“MWh”) of electricity on a proportional basis in the third quarter of 2018 compared to 1,513,997 MWh sold in the same period last year. Pattern Energy sold 6,021,515 MWh of electricity on a proportional basis for the nine months ended September 30, 2018 (“YTD 2018”) compared to 5,663,782 MWh sold in the same period last year. The 7% increase in the quarterly period was primarily due to volume increases as a result of acquisitions in 2017 and 2018, favorable wind and increased availability compared to last year. Production for the quarter was 8% below the long-term average forecast for the period with strength in Canada, Japan and Puerto Rico offset by weakness in the Eastern U.S.
Net cash provided by operating activities was $106.9 million for the third quarter of 2018 compared to $2.1 million for the same period last year. Net cash provided by operating activities was $230.5 million for YTD 2018 as compared to $159.3 million for the same period last year. The increase in the quarterly period of $104.8 million was primarily due to a $24.3 million increase in revenue (excluding unrealized loss on energy derivative and amortization included in electricity sales), a $33.8 million increase in advanced lease revenue, decreased payments of $26.7 million in payable, accrued and current liabilities, due primarily to the timing of payments, a $13.6 million increase in other current assets primarily due to a $7.7 million increase in sales tax receivable and a $7.3 million increase in related party receivable, a $6.5 million decrease in interest payments, and a $1.7 million decrease in transmission costs. The increase to net cash provided by operating activities was partially offset by a decrease of $1.6 million in distributions from unconsolidated investments.
Cash available for distribution increased 235% to $31.7 million for the third quarter of 2018, compared to $9.5 million for the same period last year. Cash available for distribution increased 28% to $133.4 million for YTD 2018 compared to $103.8 million for the same period in the prior year. The $22.2 million increase in the quarterly period was primarily due to a $24.3 million increase in revenues (excluding the unrealized loss on the energy derivative and amortization included in electricity sales) due to acquisitions in 2017 and 2018, a $5.9 million decrease in principal payments of project-level debt, a $1.7 million decrease in transmission costs and a $0.8 million increase in the release of restricted cash. These increases were partially offset by a $3.0 million increase in distributions to noncontrolling interests, a $4.0 million decrease in distributions from unconsolidated investments and $1.4 million of costs related to the sale of El Arrayán.
Net loss was $31.5 million in the third quarter of 2018, compared to a net loss of $48.4 million for the same period last year. Net loss was $45.9 million for YTD 2018 compared to a net loss of $60.5 million in the same period last year. The improvement of $16.8 million in the quarterly period was primarily attributable to a $26.4 million increase in revenue due to 2017 and 2018 acquisitions and a $5.1 million decrease in other expense primarily due to gains on derivatives. These increases were partially offset by a $4.5 million increase in cost of revenue related to 2017 and 2018 acquisitions, a $3.3 million increase in operating expenses related to an impairment expense on the El Arrayán sale and a $6.9 million increase in tax provisions.
Adjusted EBITDA increased 45% to $79.5 million for the third quarter of 2018 compared to $54.7 million for the same period last year. Adjusted EBITDA increased 19% to $292.2 million for YTD 2018 compared to $244.8 million for the same period last year. The $24.8 million increase in the quarterly period was primarily due to a $24.3 million increase in revenue (excluding unrealized loss on energy derivative and amortization included in electricity sales) primarily attributable to volume increases as a result of 2017 and 2018 acquisitions, favorable wind and increased availability compared to last year. Adjusted EBITDA for the third quarter also reflects a charge to earnings of approximately $4.3 million for the equity pick-up in the financial results of Pattern Development 2.0.
2018 Financial Guidance
Pattern Energy is re-confirming its targeted annual cash available for distribution(2) for 2018 within a range of $151 million to $181 million, representing an increase of 14% compared to cash available for distribution in 2017.
(2) The forward looking measure of 2018 full year cash available for distribution (CAFD) is a non-GAAP measure that cannot be reconciled to net cash provided by operating activities as the most directly comparable GAAP financial measure without unreasonable effort primarily because of the uncertainties involved in estimating forward-looking changes in working capital balances which are added to earnings to arrive at cash provided by operations and subtracted therefrom to arrive at CAFD. A description of the adjustments to determine CAFD can be found within Item 2, Management’s Discussion and Analysis of Financial Condition and Results of Operations – Key Metrics, of Pattern Energy’s 2018 Quarterly Report on Form 10-Q for the period ended September 30, 2018.
Quarterly Dividend
Pattern Energy declared a dividend for the fourth quarter 2018, payable on January 31, 2019, to holders of record on December 31, 2018 in the amount of $0.4220 per Class A common share, which represents $1.688 on an annualized basis. The amount of the fourth quarter 2018 dividend is unchanged from the third quarter 2018 dividend.
Acquisition Pipeline
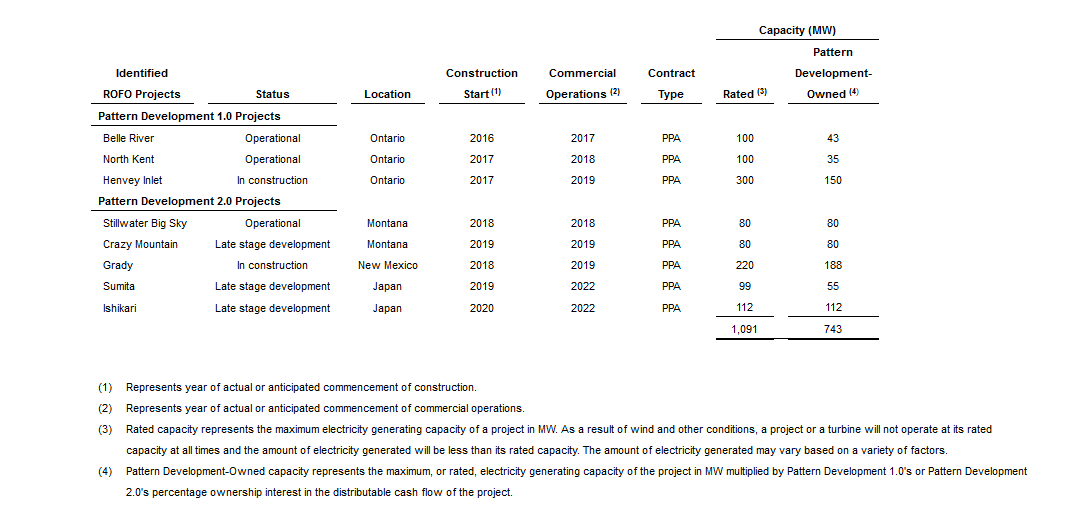
Pattern Energy Group LP (Pattern Development 1.0) and Pattern Development 2.0 (together, the Pattern Development Companies) have a pipeline of development projects totaling more than 10 GW. Pattern Energy has a ROFO on the pipeline of acquisition opportunities from the Pattern Development Companies. The identified ROFO list stands at 743 MW of potential owned capacity and represents a portion of the pipeline of development projects of the Pattern Development Companies, which are subject to Pattern Energy’s ROFO. Since its IPO, Pattern Energy has purchased, or agreed to purchase, 1,564 MW from Pattern Development 1.0 and in aggregate grown the identified ROFO list from 746 MW to more than 2 GW.
Below is a summary of the identified ROFO projects that Pattern Energy has the right to purchase from the Pattern Development Companies in connection with its respective purchase rights:
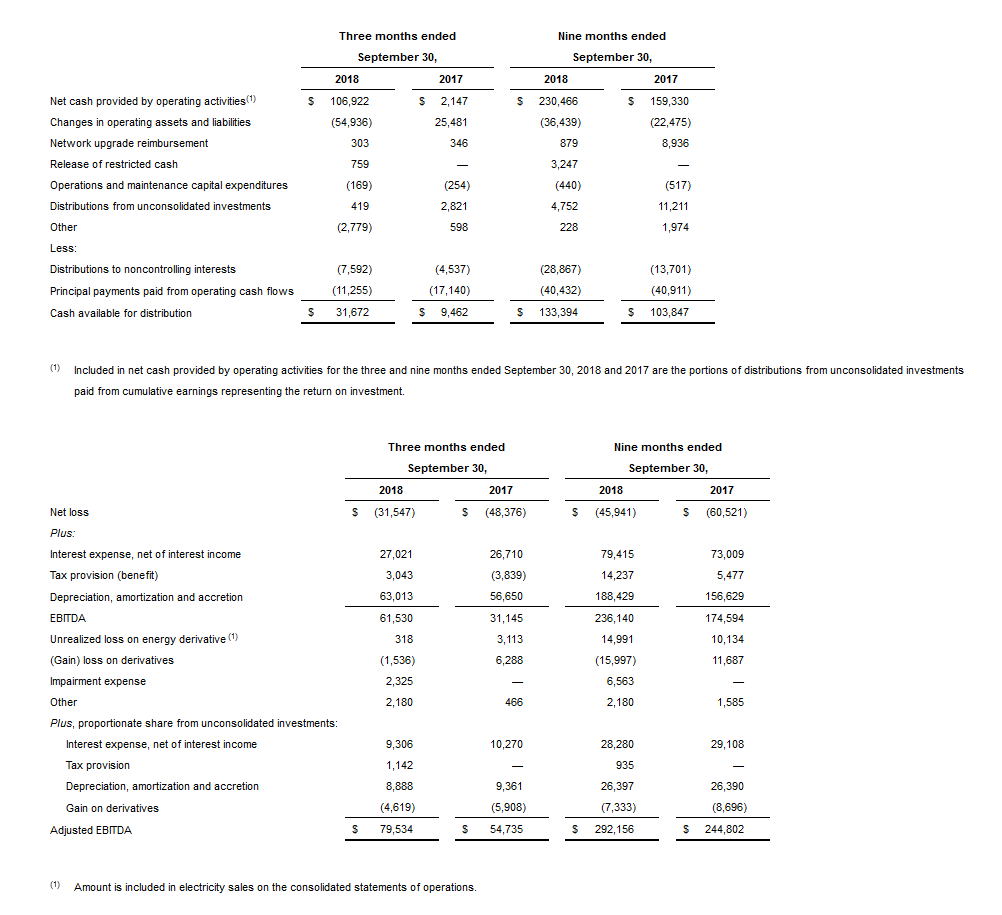
Cash Available for Distribution and Adjusted EBITDA Non-GAAP Reconciliations
The following tables reconcile non-GAAP net cash provided by operating activities to cash available for distribution and net loss to Adjusted EBITDA, respectively, for the periods presented (in thousands):
Conference Call and Webcast
Pattern Energy will host a conference call and webcast to discuss these results at 10:30 a.m. Eastern Time on Monday, November 5, 2018. Mike Garland, President and CEO, and Mike Lyon, CFO, will co-chair the call. Participants should call (888) 231-8191 or (647) 427-7450 and ask an operator for the Pattern Energy earnings call. Please dial in 10 minutes prior to the call to secure a line. A replay will be available shortly after the call. To access the replay, please dial (855) 859-2056 or (416) 849-0833 and enter access code 4369558. The replay recording will be available until 11:59 p.m. Eastern Time, November 28, 2018.
A live webcast of the conference call will be also available on the events page in the investor section of Pattern Energy’s website at www.patternenergy.com. An archived webcast will be available for one year.
***
#LatAmNRG