(Talos Energy Inc., 6.Aug.2018) – Talos Energy Inc. announced its financial and operational results for the second quarter ended June 30, 2018, and reaffirmed the previously released pro forma full year 2018 production, expenses and capital expenditure guidance.
Combination with Stone Energy Corporation
On May 10, 2018, Talos Energy LLC and Stone Energy Corporation completed a strategic transaction pursuant to which both became wholly-owned subsidiaries of the Company (“Stone Combination”). Talos Energy LLC was considered the accounting acquirer in the Stone Combination under accounting principles generally accepted in the United States of America (“GAAP”). Accordingly, the Company’s historical financial and operating data, which cover periods prior to May 10, 2018, reflect only the assets, liabilities and operations of Talos Energy LLC (as the Company’s predecessor through May 10, 2018), and do not reflect the assets, liabilities and operations of Stone prior to May 10, 2018.
The pro forma financial information set forth in this press release gives pro forma effect to the Stone Combination as if it occurred on January 1, 2018. Stone’s acquisition of the Ram Powell deepwater assets on May 1, 2018 and Ram Powell’s respective financial results are included in the Company’s pro forma results from May 1, 2018 onwards. Unless expressly stated as pro forma, the financial and operating data in this press release is presented in accordance with GAAP.

President and Chief Executive Officer Timothy S. Duncan commented, “It was a historical quarter for Talos, as we closed our transformational acquisition of Stone and the Ram Powell deepwater asset, both in May 2018. These assets will also provide significant scale and diversity to our base business, which we expect will allow us to continue to maintain positive free cash flow after investing in our capital program and servicing our debt. Production from the acquired assets will be more impactful in the second half of 2018, since Ram Powell was only partially included in the second quarter. The commencement of production from the Mt. Providence well in July, at the high end of our production rate expectations, will also positively impact the remainder of the year as compared to the first six months.
“Our growth capital is focused on two main goals, which are investing in projects that utilize our existing infrastructure to add high margin barrels with superior pricing, and continuing to pursue moderate risk but high impact exploration efforts, following the success of our significant Zama discovery in offshore Mexico. We continue to stay on schedule on both fronts.
“We also continue to find synergies related to the combination with Stone and our integration team is focused on realizing these savings by year end. The strength of the combined business will deepen our inventory portfolio and will also put us in a position to pursue accretive business development opportunities in the core areas where we currently operate.”
Reaffirmation of 2018 pro forma Full-Year Financial and Operating guidance
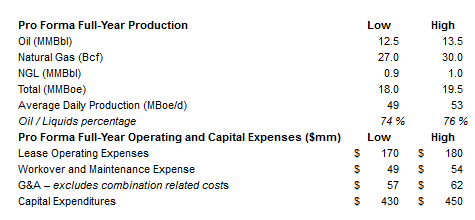
The Company reaffirms the previously released 2018 pro forma full-year financial and operating guidance. This guidance is subject to all cautionary statements and limitations described under “Cautionary Statement About Forward-Looking Statements” below:
Recent Developments and Operations Update
U.S. Gulf of Mexico
— On July 10, 2018, our Mt. Providence well began producing 60 days ahead of the originally scheduled completion date of early September. The Mt. Providence well was successfully drilled in January 2018 by Stone. We completed the well and connected it to the 100% Talos owned Pompano platform in the Company’s Mississippi Canyon Complex within six months of concluding drilling operations. The well is currently producing 3,850 Boe per day (“Boe/d”) gross (3,370 Boe/d net).
— We drilled the first two development wells in our 2018 Shelf drilling program – Ship Shoal 224 (“SS224”) E21ST and Ewing Banks 306 (“EW306”) A20 – during the first half of 2018:
– SS224 E21ST is currently producing at approximately 750 Boe/d gross (610 Boe/d net)
– The EW306 A20 well encountered approximately 120 feet of pay across 5 sands. The A20 well successfully targeted three previously defined field sands and discovered two deeper reservoirs. The deeper discovery will be completed first with an expected initial production rate of approximately 1,250 – 1,500 Boe/d gross (1,000 – 1,200 Boe/d net) starting in the third quarter of 2018. Talos owns 100% working interest (“WI”) in EW306
— Our asset management activities, typically consisting of smaller recompletions and well work, added approximately 2,000 Boe/d in the second quarter and year to date have added approximately 2,600 Boe/d, using the 30 day average of their first month of production. These opportunities represent low conversion costs, quick payouts, lower unit cost per barrel and allow us to better manage the timing of the plugging obligations of our more mature assets.
Mexico
— In April of 2018, Talos submitted the appraisal plan relating to Block 7 for the Zama discovery to the Mexican industry regulator, the National Hydrocarbons Commission (“CNH”). This appraisal plan involves, at a minimum, the drilling of three boreholes, a Drill Stem Test (DST) and extensive coring and reservoir fluid sampling. Talos has been in consultation with the CNH and anticipates timely approval of the appraisal plan. The first well in the appraisal program is planned to spud in the fourth quarter of 2018 utilizing the semi-submersible rig Ensco 8503, which is the same rig that drilled the Zama #1 discovery well in 2017. We expect the appraisal program to last through mid-year 2019.
— In July 2018, Talos requested approval from the Mexico Ministry of Energy (“SENER”) to enter into a Preliminary Unitization Agreement (“PUA”) with Pemex for a potential unit involving the Zama field in Block 7 and the Pemex grant to the east of Block 7. The PUA serves primarily to create a clear path to signing the governing Unit Agreement and Unit Operating Agreement for the Zama discovery. This will allow for a timely Final Investment Decision (“FID”) and commencement of development activities, with a goal of first production from Zama in 2022.
— In addition to Zama, the appraisal campaign proposes to deepen one wellbore to test the Marte prospect in Block 7.
— We are also focusing our efforts on executing our first exploration project on Block 2, which is located in approximately 100 feet of water. The first well will test the Bacab prospect, which is expected to be drilled in the second quarter of 2019.
SECOND QUARTER 2018 RESULTS
Production, Realized Prices and Revenue
Production: Production for the second quarter of 2018 was 3.9 million Boe compared to 2.6 million Boe for the second quarter of 2017. Second quarter of 2018 production was comprised of 2.7 million barrels of oil, 0.3 million barrels of NGLs and 5.9 billion cubic feet (“Bcf”) of natural gas. Oil and NGLs production accounted for 75% of the total production for the second quarter of 2018, as compared to 73% of the same period in 2017.
On a pro forma basis, production for the second quarter of 2018 was 4.7 million Boe. Second quarter of 2018 pro forma production was comprised of 3.2 million barrels of oil, 0.3 million barrels of NGLs and 7.0 Bcf of natural gas. Oil and NGLs production accounted for 75% of the total pro forma production for the second quarter of 2018.
Production was negatively affected by two unplanned third-party downtime events in the second quarter. Helix required an eight-day downtime in the Helix Producer 1 (“HP-1”), effectively shutting-in production from the Phoenix and Tornado fields by the same number of days. In addition, downtime in third-party pipelines further affected the quarter by curtailing production from several shallow water fields. These brief interruptions were limited to the second quarter and are not expected to have an impact in our reaffirmed annual production guidance.
The table below provides additional detail of our oil, natural gas and NGLs production volumes and sales prices per unit for the three months and six months ended on June 30, 2018:
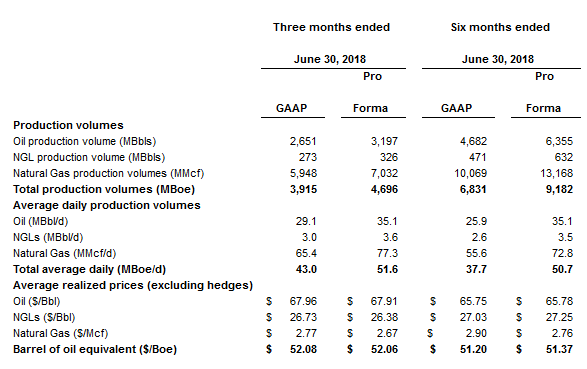
Revenue: Total revenue for the three months ended June 30, 2018 was $203.9 million compared to $95.4 million for the three months ended June 30, 2017, an increase of approximately $108.5 million, or 114%.
Oil revenue increased approximately $101.4 million, or 129%, during the three months ended June 30, 2018. This increase was primarily due to an increase of $21.98 per Bbl in our realized oil sales price and a 10.3 MBbl per day increase in oil production volumes, 9.6 MBbl per day of which was attributable to the Stone Combination.
Natural gas revenue increased approximately $3.6 million, or 28%, during the three months ended June 30, 2018. This increase was primarily due to a 19.1 MMcf per day increase in gas volumes, 22.6 MMcf per day of which was attributable to the Stone Combination, partially offset by a $0.29 per Mcf decrease in our realized gas sales price.
NGL revenue increased approximately $3.9 million, or 112%, during the three months ended June 30, 2018. This increase was due to an increase of $6.03 per Bbl in our realized NGL sales price and a 1.2 MBbl per day increase in NGL volumes, all of which were attributable to the Stone Combination.
Expenses
Lease operating expense: Total lease operating expense for three months ended June 30, 2018 was $38.9 million compared to $31.9 million for the three months ended June 30, 2017, an increase of approximately $6.9 million, or 22%. This increase was primarily related to $9.9 million of lease operating expense in connection with the Stone Combination, partially offset by a $2.9 million decrease due to additional reimbursements related to our production handling agreements primarily in the Phoenix Field.
Depreciation, depletion and amortization: Depreciation, depletion and amortization expense for the three months ended June 30, 2018 was $67.7 million compared to $36.2 million for the three months ended June 30, 2017, an increase of approximately $31.6 million, or 87%. This increase is primarily due to a $3.33 per Boe, or 24%, increase in the depletion rate on our proved oil and natural gas properties during the three months ended June 30, 2018. Depletion on a per Boe basis increased primarily due to an increase in proved properties related to the Stone Combination and higher estimated future development costs related to proved undeveloped reserves in the Phoenix Field.
General and administrative expense: General and administrative expense for the three months ended June 30, 2018 was $30.9 million compared to $7.5 million for the three months ended June 30, 2017, an increase of approximately $23.4 million, or 313%. This increase was primarily attributable to $18.3 million in transaction related costs related to the Stone Combination and additional general and administrative expenses as a result of the combined company. In connection with the Stone Combination, we expect to capture significant synergies, and Talos is focused on realizing these savings by year-end 2018.
Other operating expense: Other operating expense for the three months ended June 30, 2018 was $27.2 million compared to $13.5 million for the three months ended June 30, 2017, an increase of approximately $13.7 million, or 101%. This increase was primarily related to an increase of $4.5 million and $4.1 million in workover and maintenance expense and accretion expense, respectively, in connection with the Stone Combination. This increase also relates to a $5.0 million increase in repairs and maintenance during the three months ended June 30, 2018 primarily related to $1.3 million in repairs on SMI 130 and inspection and reconnection support in the Phoenix Field of $1.2 million.
Price risk management activities: Price risk management activities for the three months ended June 30, 2018 resulted in a $91.2 million expense compared to income of $39.0 million for the three months ended June 30, 2017. The change of approximately $130.2 million was attributable to an $87.4 million decrease in the fair value of our open derivative contracts and a $42.8 million decrease in cash settlement gains for the three months ended June 30, 2018.
Other financial metrics
Net Income (Loss) and Adjusted EBITDA: Net Income (Loss) in the second quarter of 2018 was ($75) million and in the first six months of the year ($98) million. The loss numbers are primarily due to non-cash mark-to-market expenses associated with unrealized commodity hedges. Pro forma Net Income (Loss) in the second quarter of 2018 was ($46) million and in the first six months of the year ($51) million. The pro forma loss numbers are primarily due to non-cash mark-to-market expenses associated with unrealized commodity hedges.
Adjusted EBITDA for the three months ended on June 30, 2018 was $101 million and Adjusted EBITDA margin was 50%, or $25.89 per Boe. For the first half of 2018, Adjusted EBITDA was $187 million, with a margin of 53% or $27.37 per Boe. Excluding the effect of hedges, the margins would have been 66% or $34.48 per Boe for the second quarter and 69% or $35.28 for the first six months of the year.
Pro forma Adjusted EBITDA for the three months ended June 30, 2018 was $128 million and pro forma Adjusted EBITDA margin was 52%, or $27.18 per Boe. For the first half of 2018, pro forma Adjusted EBITDA was $269 million, with a margin of 57% or $29.30 per Boe. Excluding the effect of hedges, the pro forma margins would have been 67% or $34.79 per Boe for the second quarter and 70% or $35.79 per Boe for the first six months of the year.
Financial position: As of June 30, 2018, the Company had approximately $648 million of long-term debt, excluding deferred financing costs and original issue discount. The balance includes $397 million of second lien notes, $240 million of borrowings under the bank credit facility and an $11 million building loan. In addition to the Company’s long-term debt, as of June 30, 2018, Talos had a capital lease obligation with a balance of approximately $100 million.
Liquidity position: As of June 30, 2018, the Company had a liquidity position of approximately $433 million, which included $354 million available under the $600 million bank credit facility and approximately $79 million of cash.
Leverage and credit metrics: The pro forma annualized Adjusted EBITDA for the six months ended on June 30, 2018 was $538 million. As of June 30, 2018, the Company’s total debt was $748 million and net debt was $669 million, both including capital lease. Therefore, the Net Debt to annualized pro forma Adjusted EBITDA ratio of Talos was 1.2x.
***